News: Now offering a 90-day money-back guarantee!
Learn more
News: Now offering a 90-day money-back guarantee!
Learn moreBadger Insights transforms complex, disjointed data into easy-to-use dashboards and maps. Instead of hunting through spreadsheets, your team gets a live, visual view of everything happening across their territories. The result is faster decisions, smarter coverage, and more revenue.
State level success: revenue by state divided by state population
Badger Insights is mapping software that connects to CRMs and other data sources, so sales people can access and work with their data all in one place.
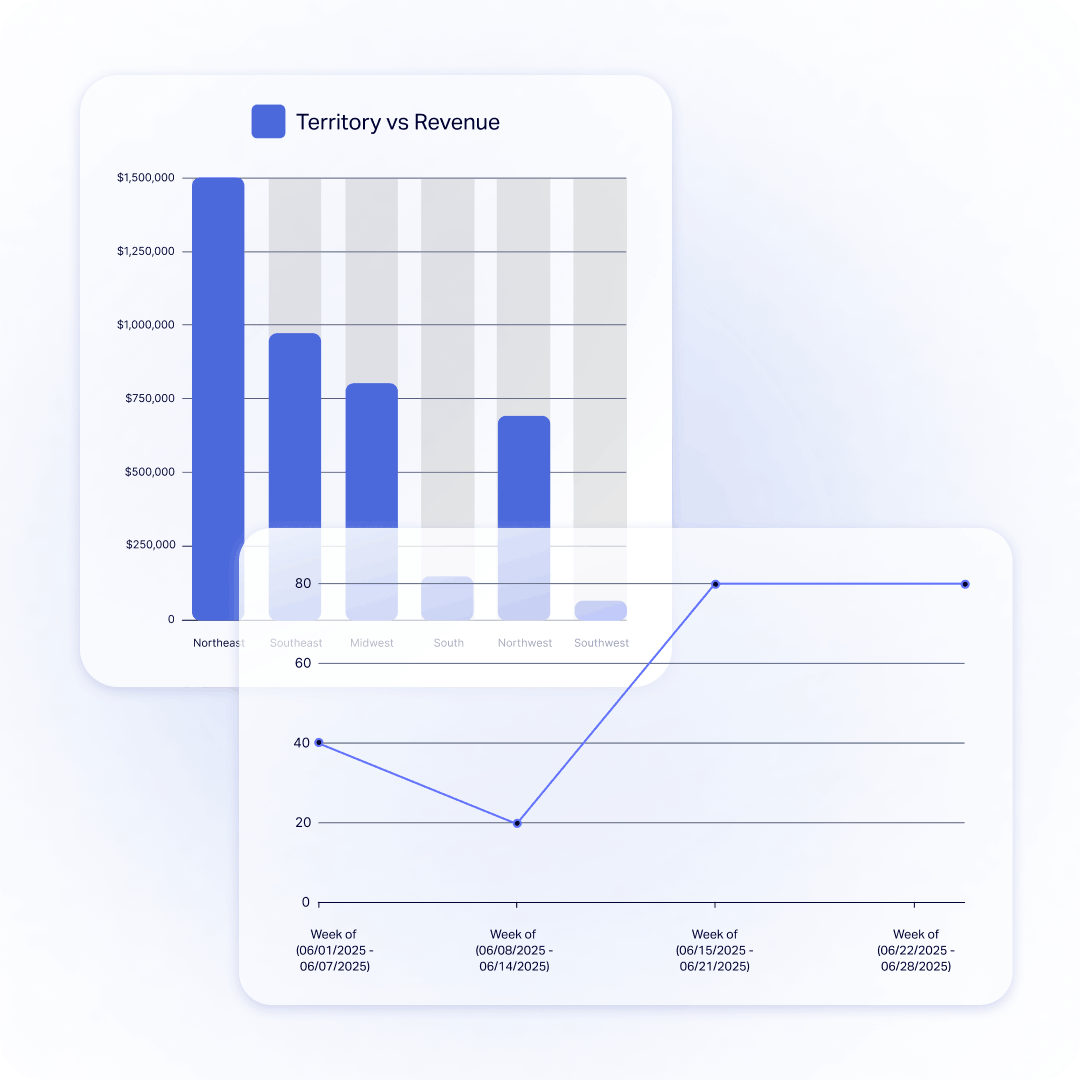
No need to fumble with sheets and graphs in Excel. Badger Insights offers customizable charts and graphs so you can see the data you want, the way you want to see it. With metrics like visit frequency, revenue by territory, account penetration, and rep performance all in one place, managers can spot trends and course correct before those trends become problems.
When data lives in a spreadsheet, it takes time to interpret. When it lives on a map, patterns jump out instantly. Territory mapping tools collapse the time between insight and action — for both reps and management.
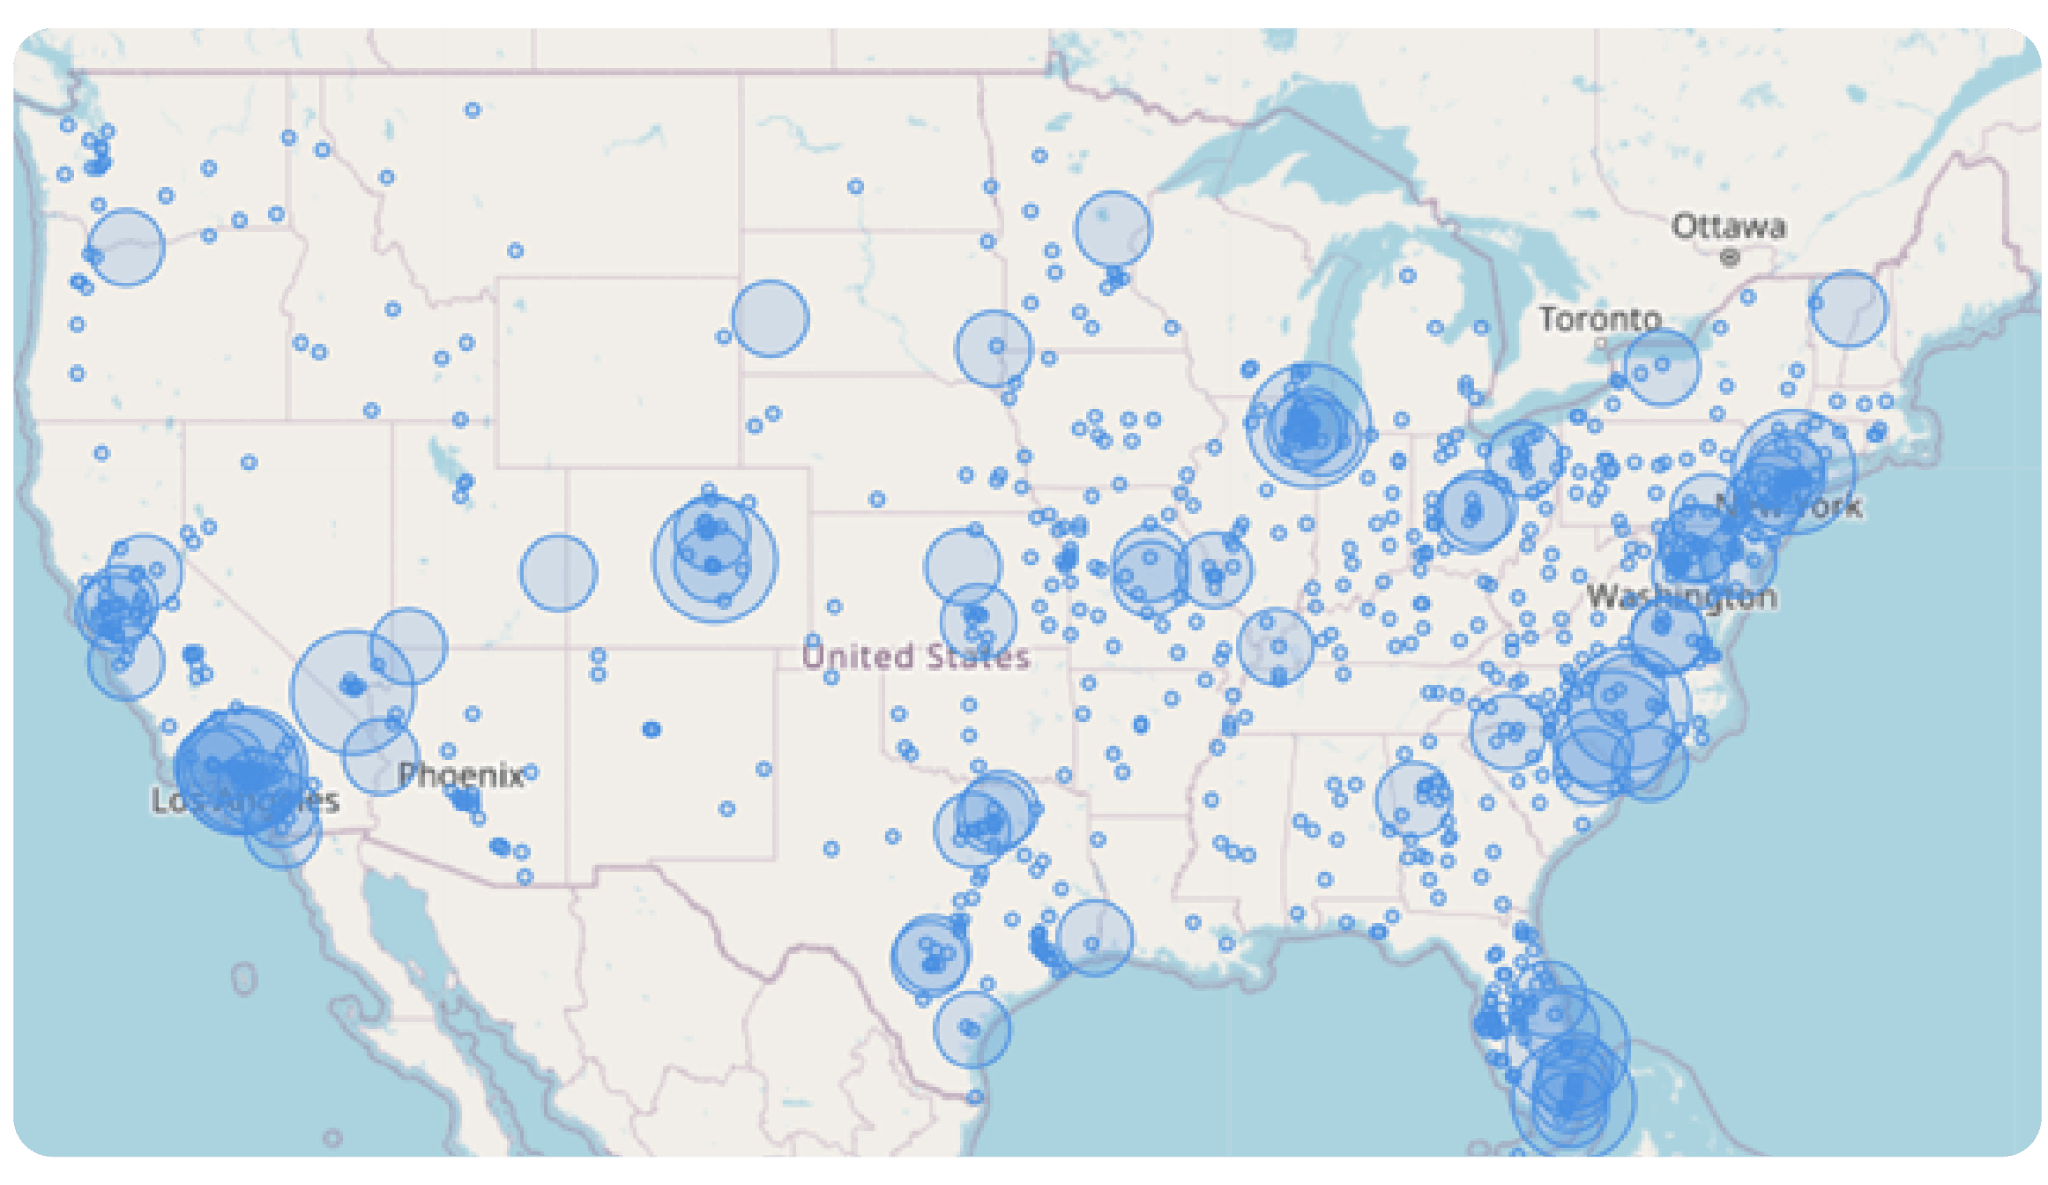
Bubble maps will help you spot areas with the highest number of accounts or deal volume to know where to focus your time and resources.
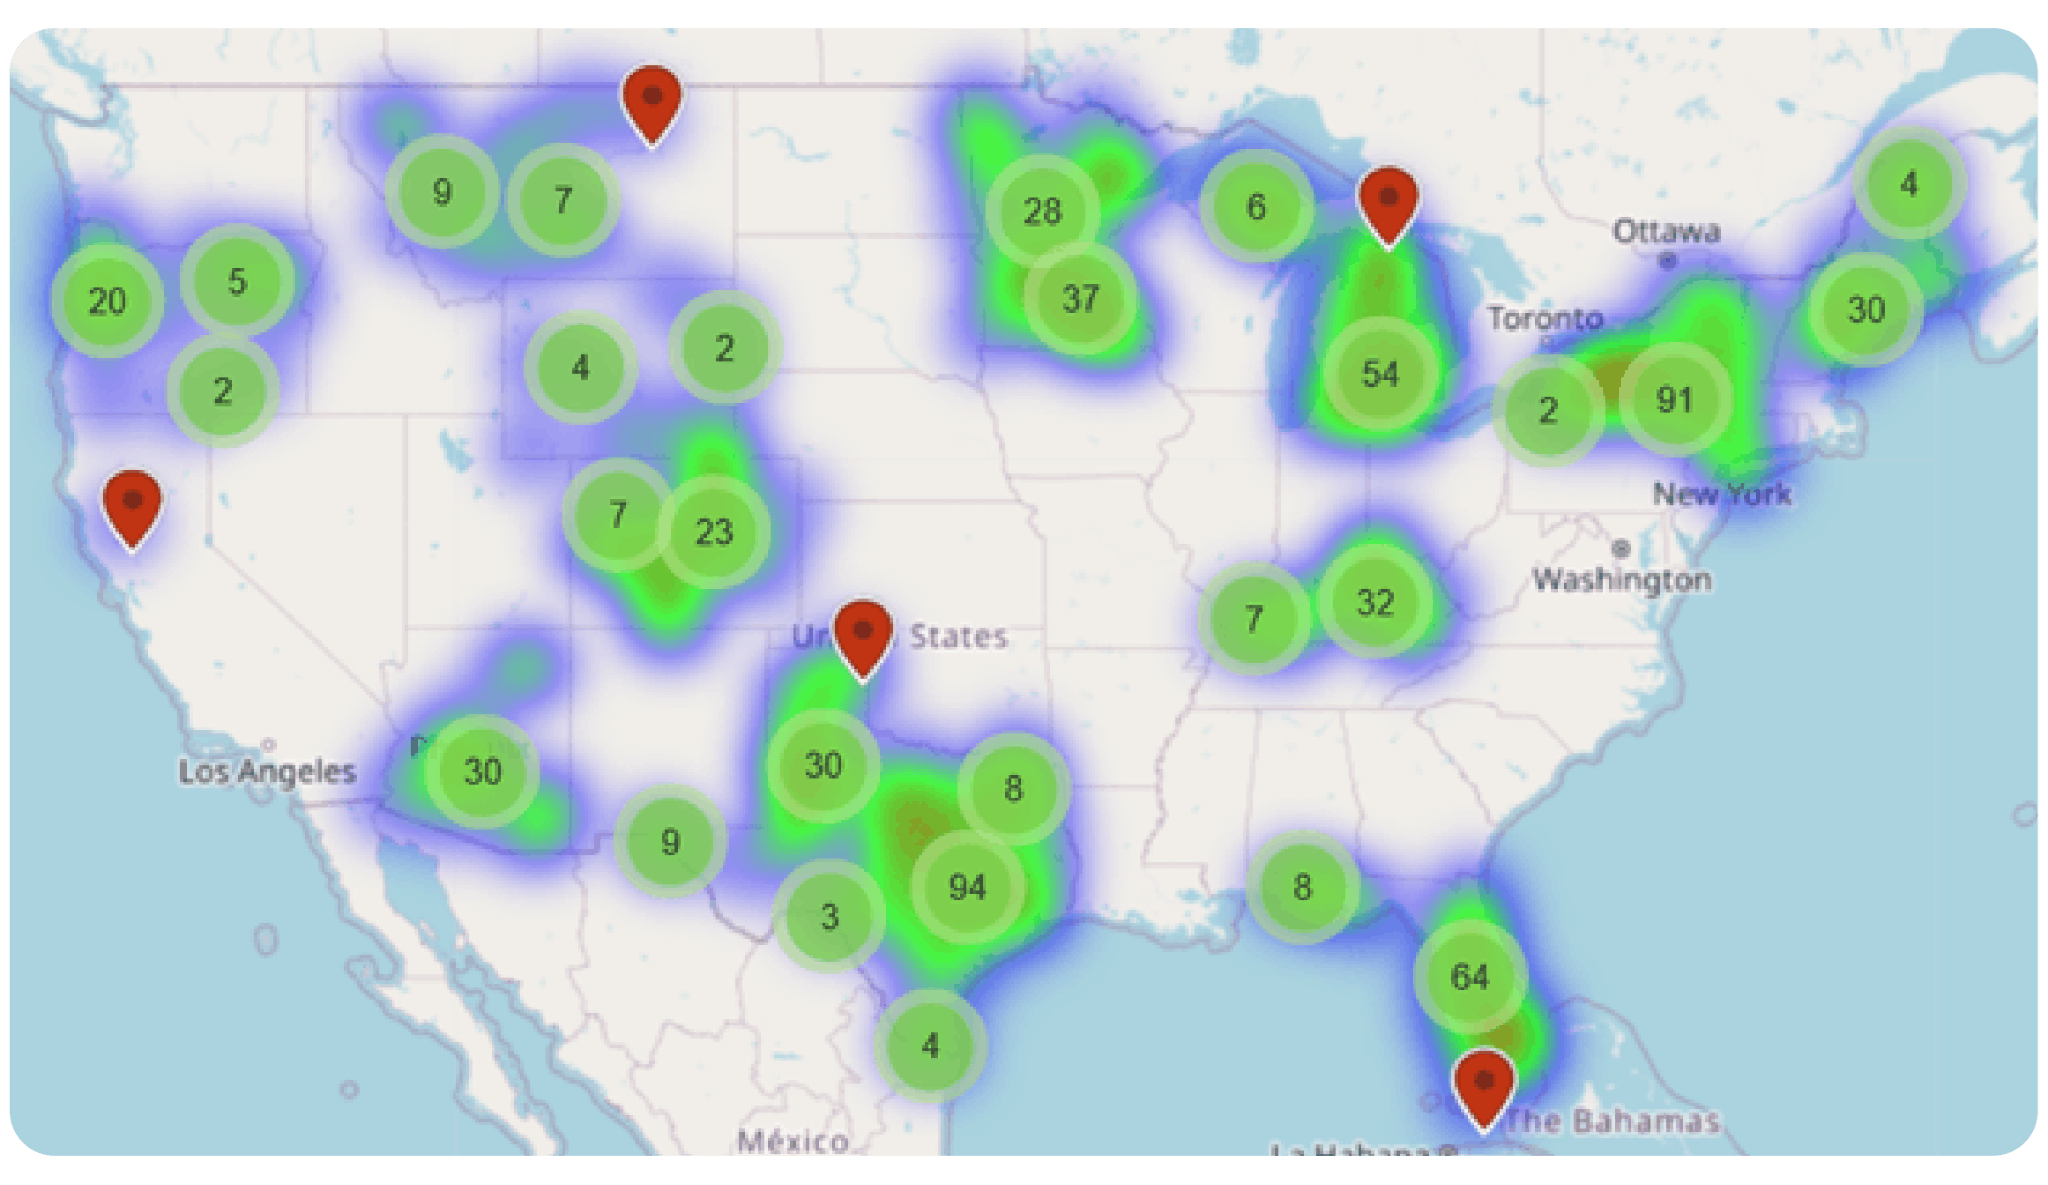
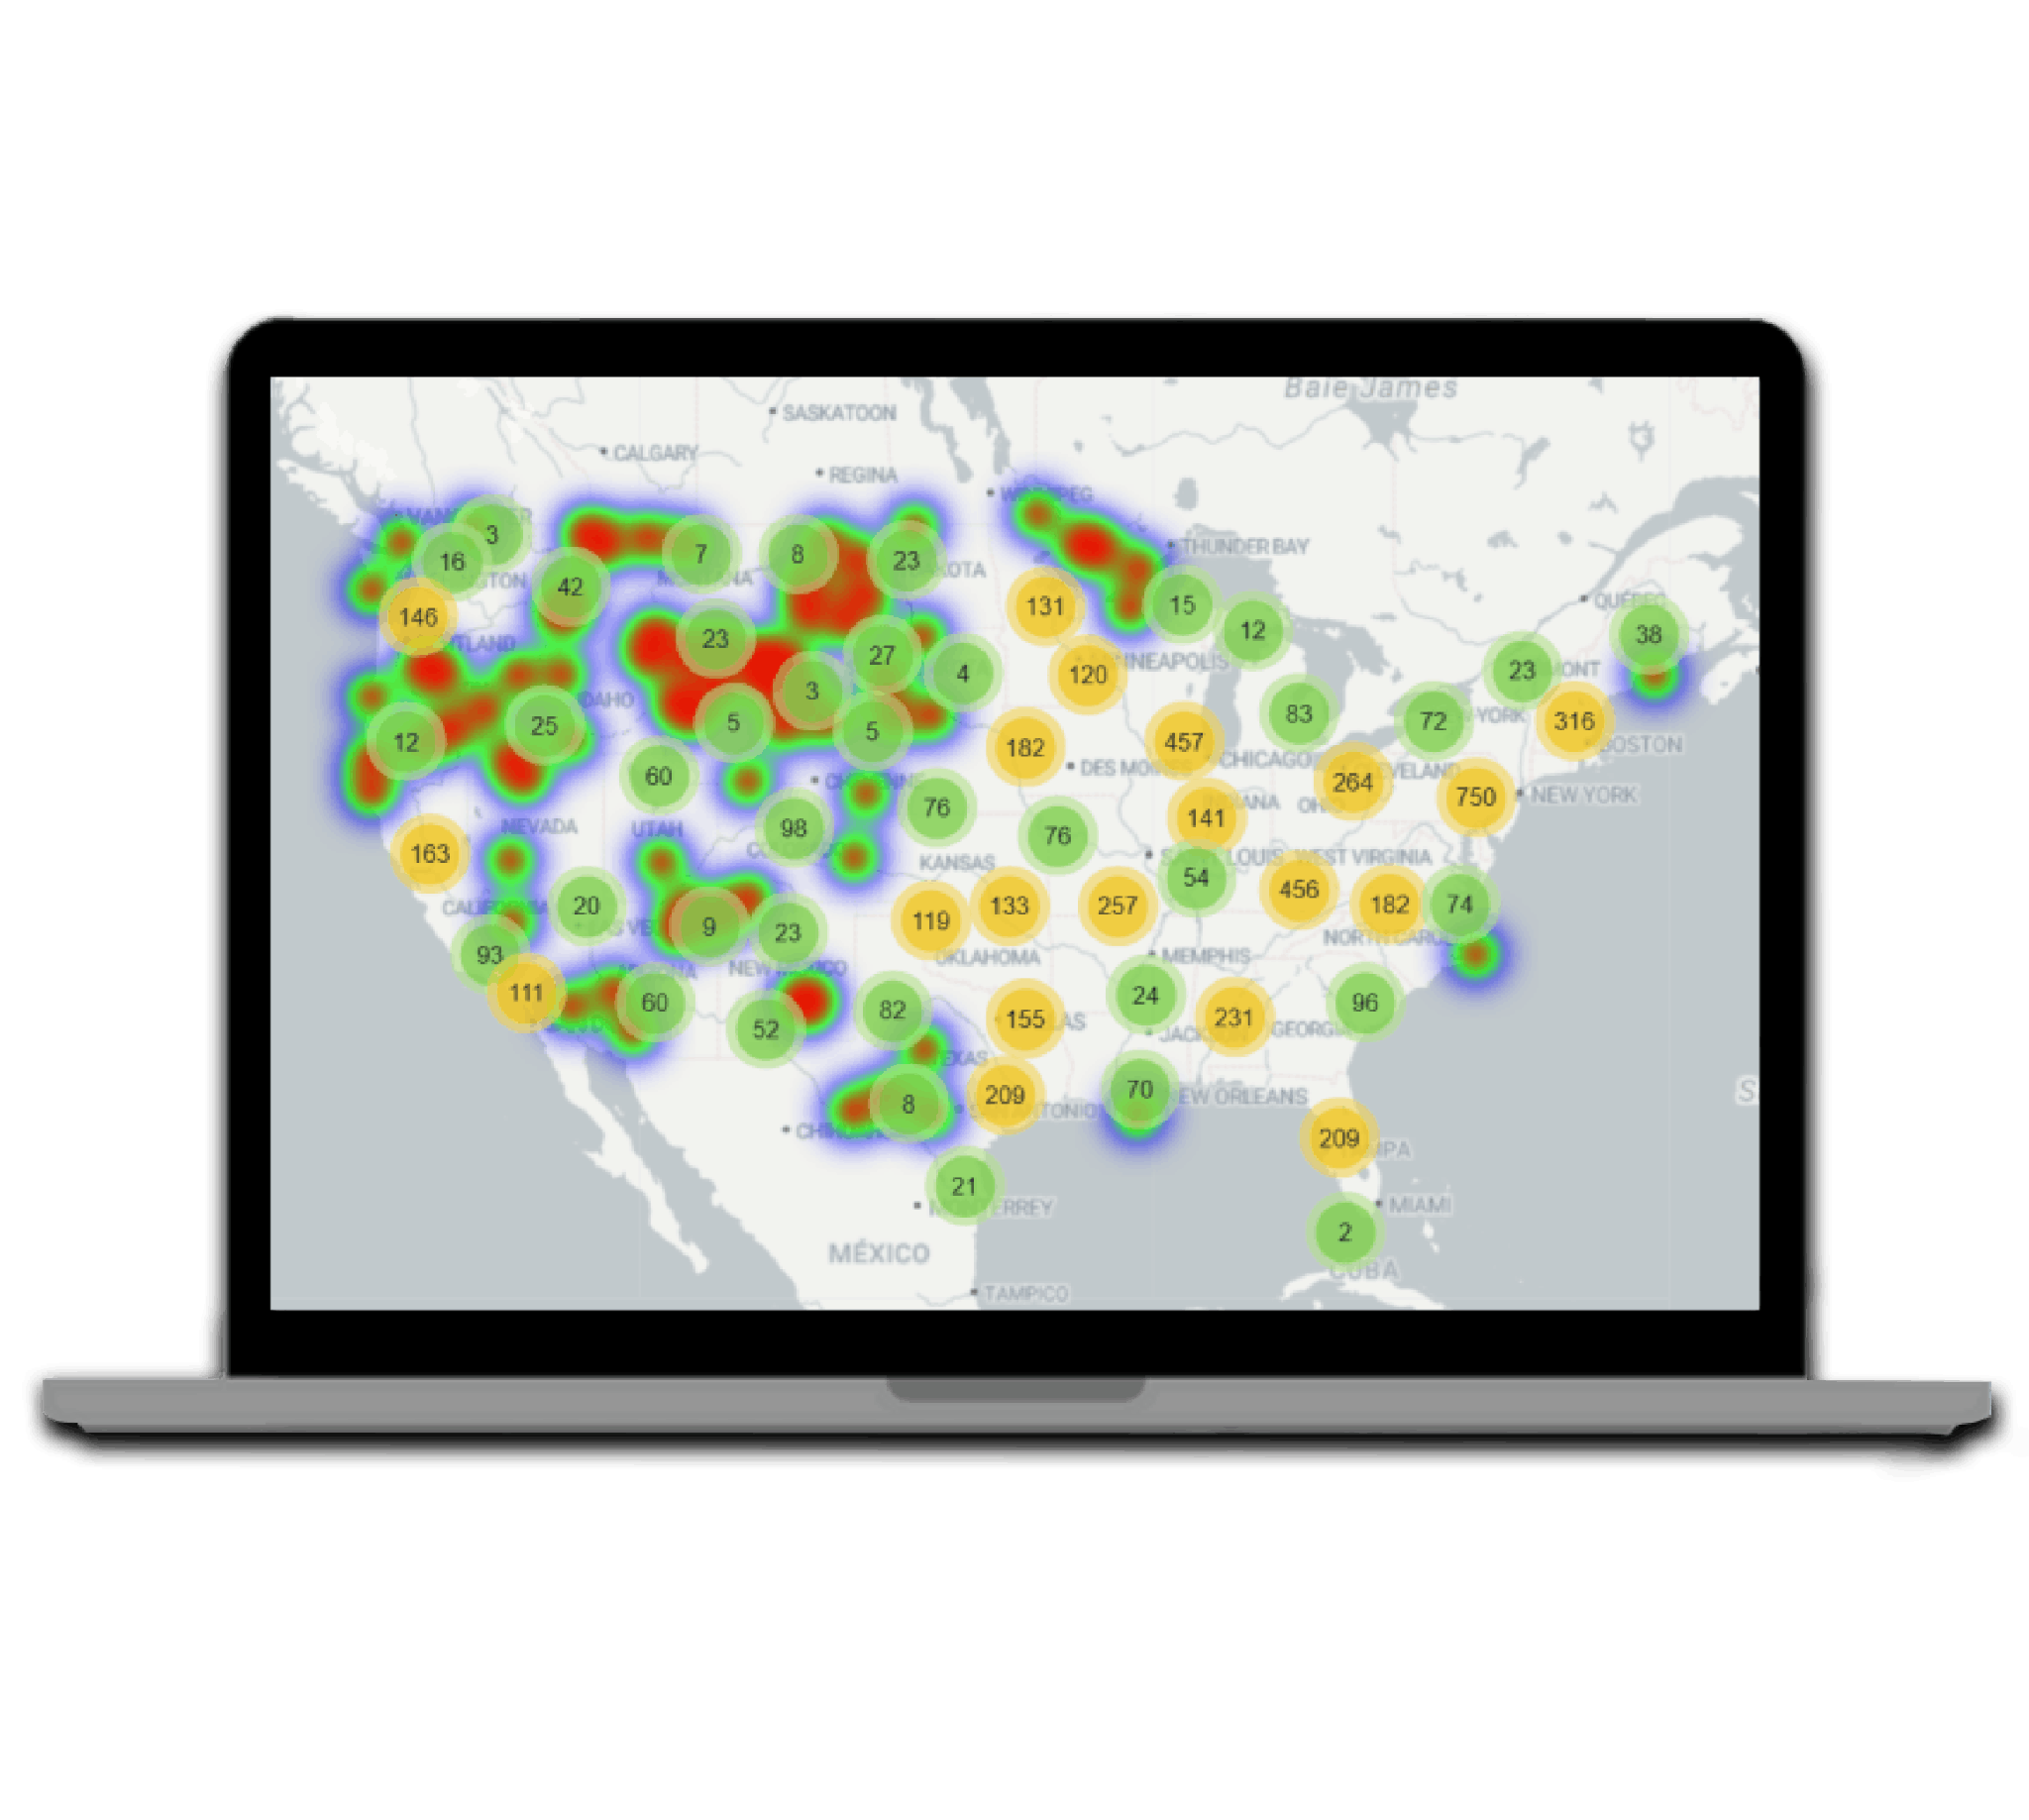
Heat maps uncover patterns in your team’s performance so you can tell whether a territory is being over or under served.
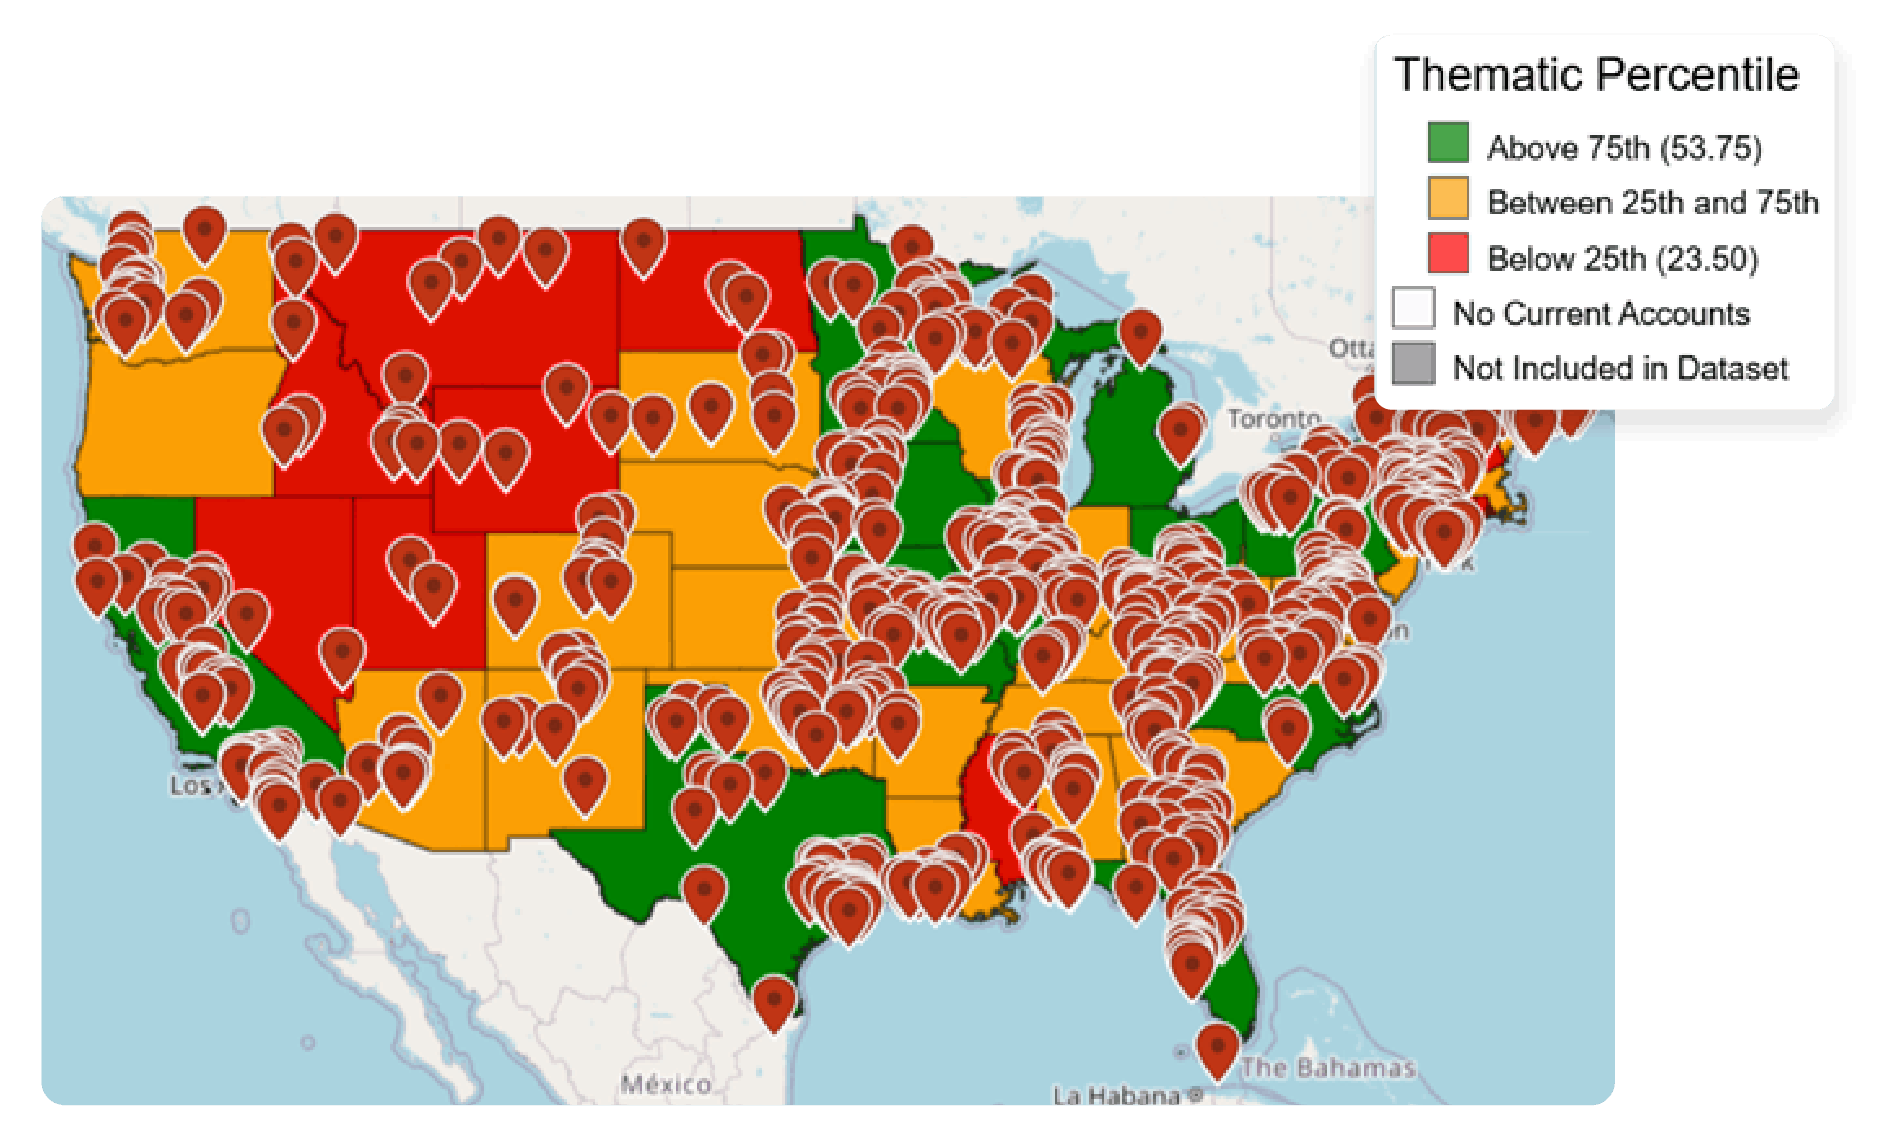
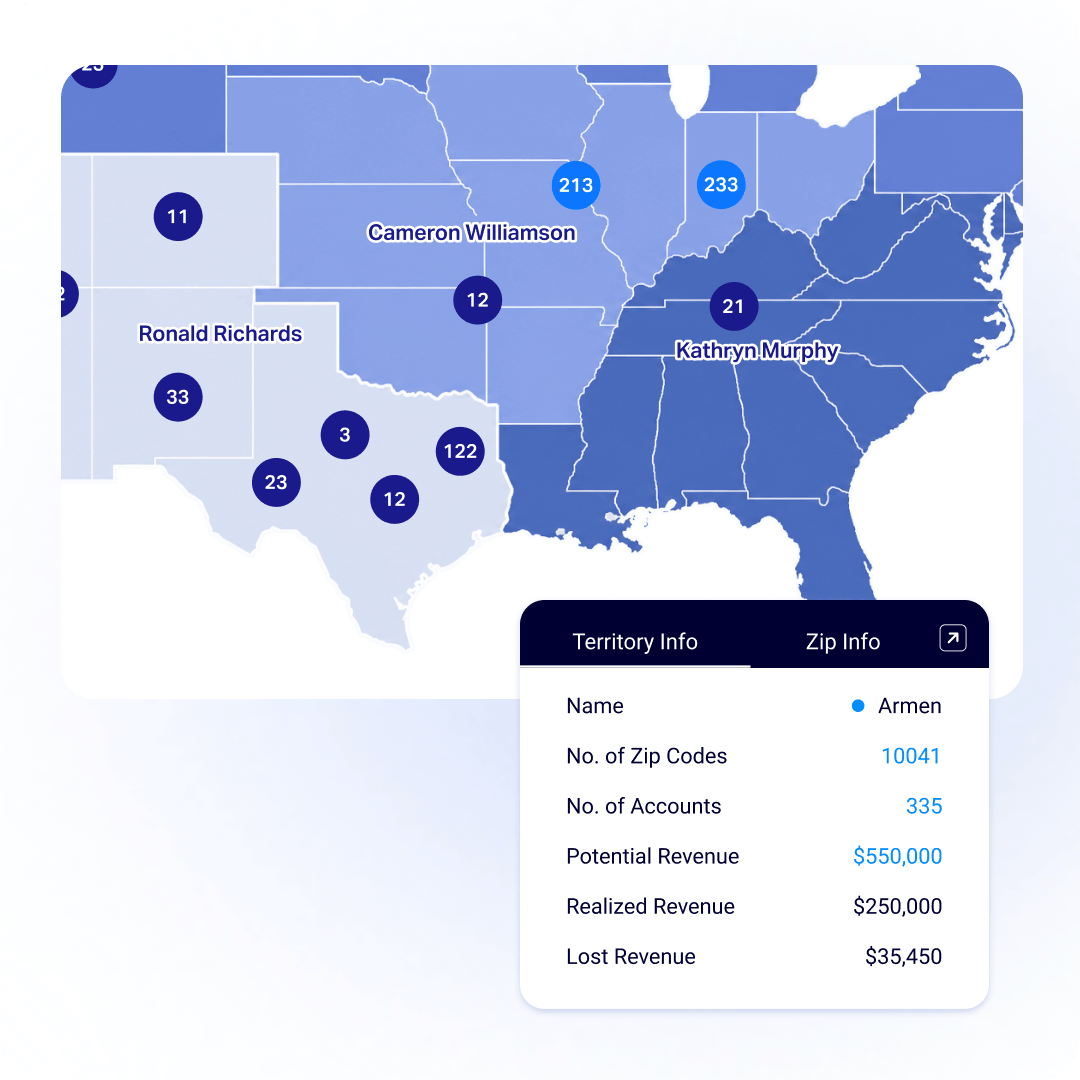
Thematic maps help you instantly visualize how a specific metric varies by region without digging through spreadsheets.
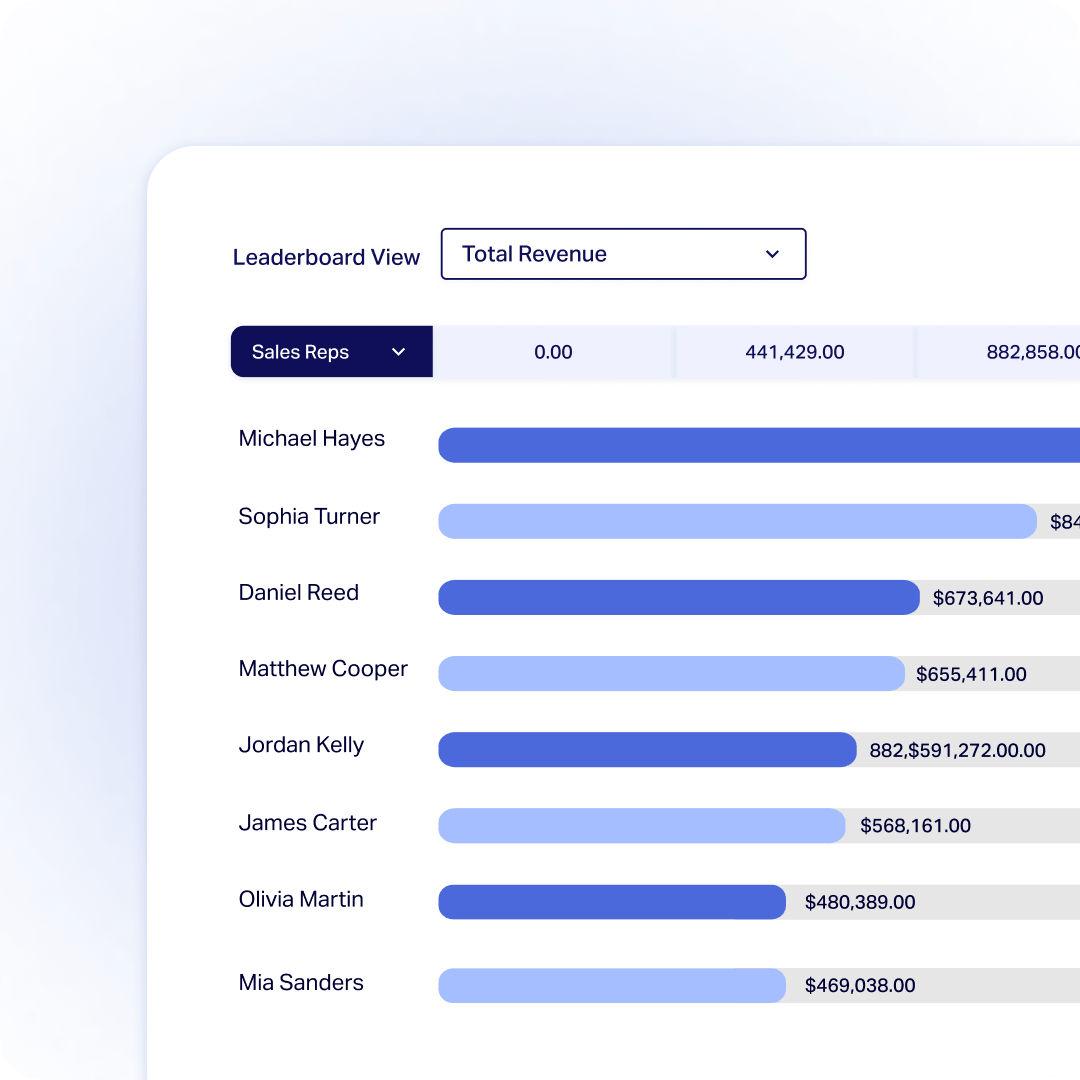
Lacking visibility into your reps' activities? With performance dashboards, you can quickly see where each deal is at in the sales cycle, monitor your reps' performance, and improve the accuracy of your sales forecasts.
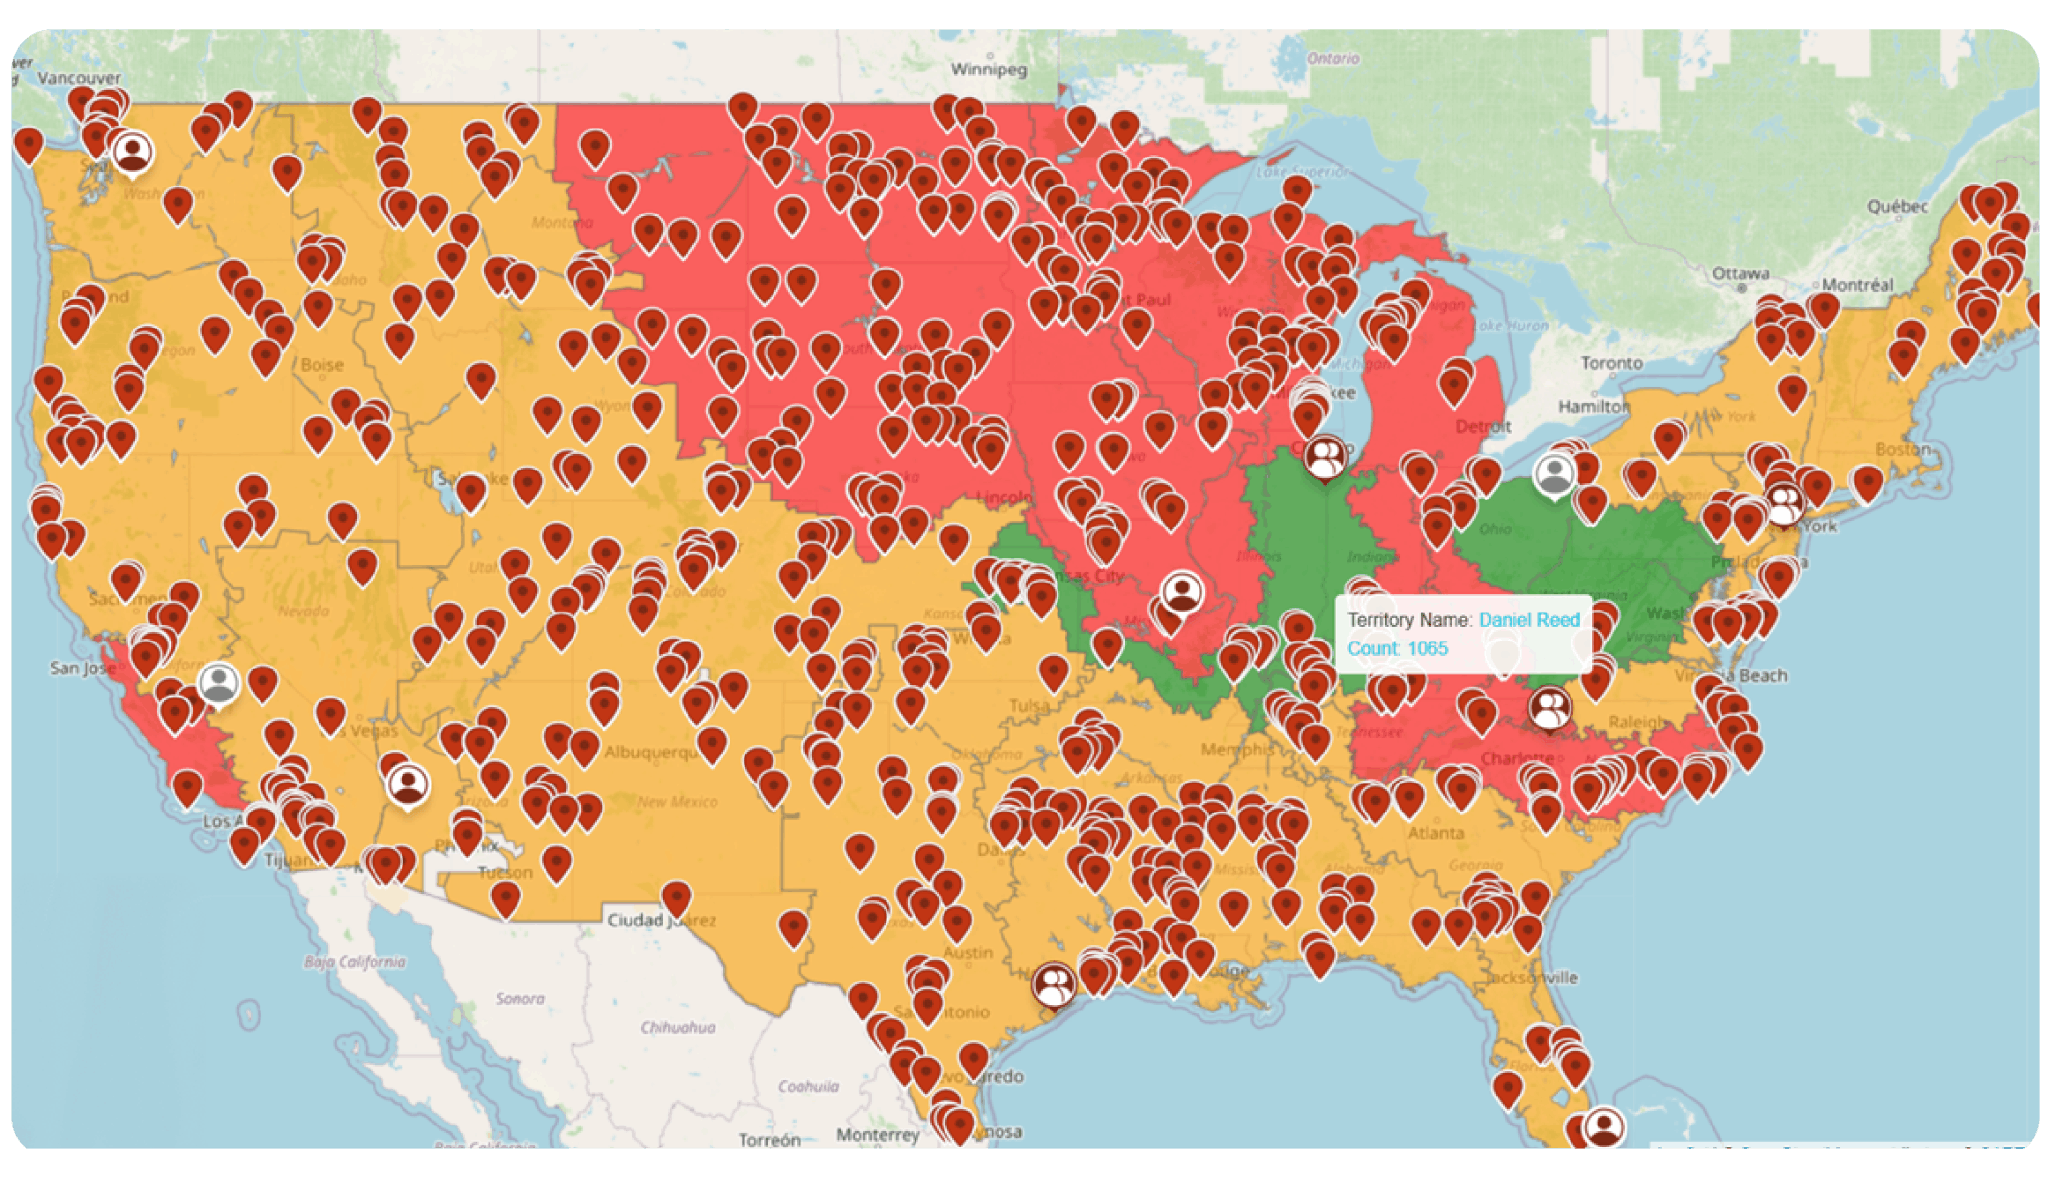
See account density, revenue concentration, and travel time across your territories — and make smarter decisions about rep coverage and territory design in real time.
All of our tools are integrated with the leading CRMs so you can assess changes in the field in real time.
Heat maps and thematic maps show where revenue, account density, and untapped potential are concentrated — so leadership can make strategic decisions based on data, not gut feel.
Bubble maps and thematic overlays make it easy to spot imbalances — where one rep is overloaded and another underleveraged — so you can realign coverage to maximize productivity across the entire team.
Field activity shouldn't be a mystery until the numbers come in. Customizable charts and graphs surface what's happening across your team in real time, so managers always know where to focus and how to advise their teams.
The gap between having data and acting on it is where deals are lost. Territory mapping tools put your insights directly on the map, so you can quickly see what’s working, what isn’t and where to focus your time.
Visual territory data gives sales, marketing, and leadership a shared view of what's happening in the field — making cross-functional planning faster and more aligned.
Turn your data into actionable insights that transform your business. Schedule a demo today to learn more.
Looking for our logo?
Grab a Zip packed with our logo in PNG and EPS formats.